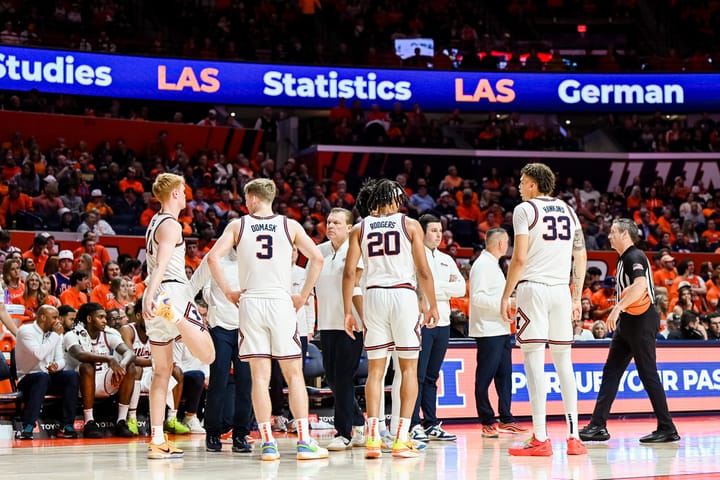
Where Do We Stand? January 9th

Here's the plan: I'll call these Where Do We Stand so they're easily searched in the archive. I'll publish them on Monday or Tuesday each week. I'll put together the Illini NERDstat Index (the I-N-I) and I'll take a look at the NET rankings each week. And then you'll have an idea of where we stand when it comes to the Big Ten race and our NCAA Tournament seeding.
We'll start with the NET team sheet. This is from yesterday, but since I put this out on Twitter yesterday and then discussed a few of the finer points, I figured I'd use the same one here. (Also, there were very few basketball games last night due to the CFP Playoff title game so the first change in the top-50 in the NET from yesterday to today was Villanova & St. John's swapping places at 33 and 34.)
Here's the NET team sheet:

First off, it's way too early to read much into anything. By mid-February we'll be able to say things like "you know, we don't really have the Q1 wins we need to push for a 2-seed" (or whatever), but today, this is a report card in mid-September. So we have a B in math after two quizzes and one test - who cares? Long way to go. (Some of you read that as "still time to get that A". I read it as "with that kind of start I can keep it above a D, right?")
The way I look at it, in January I pay attention to the ranking and in March I pay attention to the who we beat/who we lost to. The ranking itself doesn't mean much in March -- the Committee mostly uses that number to discuss teams that lost to/beat "#9 Illinois" -- but in early January, it does tell us what the Committee's formula is spitting out.
I guess this is the first one of these for the year so I should do a quick recap. When NET replaced RPI in 2018, the NET formula included five things: net efficiency, winning percentage, adjusted winning percentage, scoring margin, and something called "team value efficiency." After two years of that (and a lot of complaints about scoring margin as its own category), they removed winning percentage, adjusted winning percentage, and scoring margin in 2020. This meant that new NET rankings looked like this (graphic from the NCAA website):

So the NET is part efficiency numbers (like most of the I-N-I NERDstats) and part "who did you beat and where did you beat them?". When Northwestern beat Michigan State, that kind of helped us in three ways:
- Our efficiency numbers against Northwestern (which were off the charts) look better because the NET uses an adjusted efficiency based on the strength of your opponent.
- Our team value index goes up because strength of opponent is factored into that number for each game.
- Our team sheet looks better because Northwestern is now #71 which means that our home victory over the Wildcats is now a Quad 2 win, not a Quad 3 win.
Make sense? Obviously, it all balances out over the season. That Northwestern win lowered Michigan State's value, and we play MSU on Thursday, so basically every Big Ten game is a good news/bad news situation. Which is why, at the end of the season, the Committee uses these rankings in reverse. They look at the sheet you're seeing above and they simply review who you beat and who you lost to. Many think that it's "Illinois is #9 in the NET, so they should be the first three-seed", but it doesn't work like that at all.
The Committee will look at a lot of things (note that KenPom and BPI are both listed on the team sheets they receive as supplemental information for them to consider), but in the end, the tournament seedings always seem to come down to two things:
- What's your record in Quad 1 + Quad 2 games?
- Did you have any bad losses? (Quad 3 or Quad 4)
If Northwestern were to improve and put themselves in Tournament contention, that Chicago State loss will be hanging around their necks all season. It's the single worst loss in college basketball this season (Chicago State is #300 in the NET). So when evaluating these team sheets and comparing teams, don't forget to glance over at the Q3 and Q4 columns to see if those teams have any bad losses.
All of that to say… we don't know much yet. Purdue is 2 and Tennessee is 5 and so the Committee will basically completely ignore those losses on our Team Sheet. If you lose to #2 and #5 on the road, you don't even get a slap on the wrist. (And if you beat them, you get a massive jewel for your crown.)
Beyond that, the loss at home to Marquette is a knock and the win over FAU in New York City (even though FAU has had some bad losses of late) is still a jewel. Those are the only two games that truly matter at the moment as the rest of the games were of the "needed to beat them - and did" variety. It might be fun to point and laugh at a Missouri team going from bad to worse, but we need them to climb back into the top-100 (they're currently #117) so that our December 22nd win becomes a Q2 win.
Overall, the good news at this point is that our efficiency numbers are fantastic (which pushes us up to #9). The bad news: a weak Big Ten means not as many Q1 opportunities this year. We went 12-6 in Quad 1 games in 2021. This year, we might not have 12 Q1 games in total? We have four at the moment and maybe only seven or eight remaining (before the Big Ten Tournament). If we beat Michigan State on Thursday, they'll drop below #30 and that will move that win from Quad 1 to Quad 2.
Now to the I-N-I. Here's how the Big Ten looks as of today:

I just did this last Thursday (the I-N-I, like your trash day, was a bit delayed by the Monday holiday), but after the games this weekend, the takeaways are…
- We lost to Purdue and didn't move. That's a good sign.
- Michigan State keeps losing with solid efficiency numbers so they remain ranked between 10 and 20 here (and 28 in the NET) yet are 9-6.
- On the rise: Minnesota.
- Look out below: Michigan
- Uh, guys?: Indiana
The only other observation I'll make is that our schedule is proving fairly tough (which is good for our NET opportunities). If we call these the current Big Ten rankings, we are #2 at the moment and we play #1 home-and-home. #3 home-and-home, #4 only on the road and #5 only on the road. We also have home-and-homes with #6 and #7 as well. The takeaway there: we have road games with #1, #3, #4, #5, #6, and #7. We can't play #2 because… that's us.
So those will be our likely Q1 opportunities. Big games, those.
Gotta do the "get the average of our offense and defense and then compare it to a KenPom team of the past" before I get out of here, so… here we go.
KenPom: #6 offense, #17 defense
T-Rank: #11 offense, #24 defense
BPI: #14 offense, #8 defense
EvanMiya: #8 offense, #16 defense
Averages: #10 offense, #16 defense
The closest comp I could find on KenPom: 2019 North Carolina (#8 offense, #15 defense) - 1-seed lost in the Sweet 16
And if we just use our current KenPom numbers (#6 offense, #17 defense), there's an exact match. And it's a doozy. But I'm gonna put it out there anyway because it's cloudy and cold today and you need to feel warm:
2022 Kansas (exactly the same: #6 offense, #17 defense) - 1-seed, won the national title.
There you have it. Robert predicted on January 9th that we're going to win it all. Pretty sure that's exactly what he said with zero disclaimers. And certainly nothing will change as this 7-man team faces a grueling January/February schedule with lots of Q2 and Q3 pitfalls. No, we're totally winning it all.
Mark it down.


Comments ()